
A Quick Take on AvePoint
Terrific long-term compounder..

For background on the company, see our Primer
AvePoint (AVPT) has already been a big winner since we first recommended a buy at $11.97 for the SHU Growth Portfolio on Seeking Alpha, producing a 60%+ return.
Reasons to buy
Strong market tailwinds; the digitization of business, increased compliance needs, big data, and AI all increase the importance of data management.
Competitive product suite with three SaaS platforms:

These bring tangible benefits like reduced cost, increased productivity, and more informed decision-making.
Growth drivers are the explosion in data, the shift of companies to multi-cloud solutions, winning new logos, the desire for vendor consolidation and the demand for an integrated platform, the opportunities for up-and-cross-selling, and the emergence of generative AI.
New products
AvePoint Opus was launched in late 2023, it is a comprehensive solution for content lifecycle management that integrates record management, retention, archiving, and classification functionalities, enhanced by AI capabilities.
tyGraph for Copilot helps organizations determine Copilot readiness by analyzing collaboration patterns and data estates. This solution allows businesses to target specific user groups and areas for initial Copilot implementation, enabling them to maximize ROI and gain early insights into the benefits of generative AI. While tyGraph was introduced earlier, it has recently been enhanced with new functionality.
Backup Express delivers accelerated, secure data protection for all organizations is now generally available.
A new generation of Elements to empower MSPs to:
deploy standardized security and compliance configurations consistently across multiple tenants, helping them efficiently manage increasing data volumes and complex environments, thus driving growth and capitalizing on the expanding cybersecurity market.
Recent logo wins
A global online payment processing company seeking to enhance data security and governance before deploying Microsoft 365 Copilot to its 40K users.
A Canada-based insurance company aiming to improve workspace governance attestation.
A US-based healthcare provider addressing risks related to sensitive data.
A major Japanese municipal government seeking automated data governance.
A US agency needing a robust backup solution to protect critical case information.
An 8-figure deal in APAC with a prominent higher education institution replacing its on-premises system with a modern, centralized enterprise student management system.
Ydentic acquisition
In January 2025 AvePoint acquired Ydentic, a SaaS company specializing in centralized multi-tenant management for Microsoft MSPs (Managed Services Providers), which is AvePoint’s fastest-growing business: Here is Scott Sacket, AvePoint’s senior vice president of global partner strategy (CRN):
“But our fastest-growing business is through managed service providers,” he said. “Managed service providers offer an incredible access point to the SMB segment. So in a segment that’s been very hard to crack for a lot of vendors, Ydentic provides a lot of scale for us in a market that is incredibly valuable.”
The integration of Ydentic's automation capabilities enables MSPs (a $80B market in 2024) to streamline user lifecycle management, license administration, and service desk operations, thereby reducing operational costs and eliminating knowledge barriers for employees.
Ydentic's expertise in centralized multi-tenant management automates IT management tasks and enhances processes and full control for customers. It directly complements AvePoint's Elements platform, a critical tool for MSPs managing client IT environments, as Ydentic's multi-tenant management tools fill gaps, particularly in user lifecycle management and workflow automation, creating a more comprehensive solution stack, thereby improving its competitive position against competitors such as ConnectWise and Kaseya, which dominate the MSP tools market. Unlike these broader platforms, AvePoint's focus on Microsoft ecosystems and AI-driven security allows for deeper specialization.
Ydentic's existing customer base of 75–100 MSPs, some of whom overlap with AvePoint's partners, provides immediate cross-selling opportunities.
Financials
Q3 2024 Results
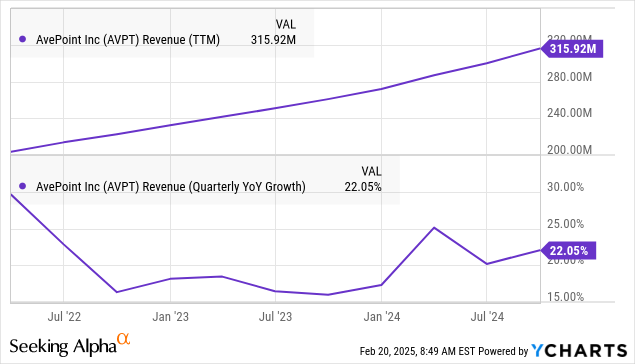
Revenue +22% to $88.8M exceeding expectations due to improved sales efficiency stemming from factors like better productivity from sales representatives, and faster ramp-up times for new reps as well as a maturing channel strategy, with an increasing amount of business coming through partners.
SaaS Revenue +45% to $61.9M, the highest growth rate in 11 quarters. SaaS comprised 69% of total revenues, compared to 58% a year prior.
ARR +23% to $308.9M.
Net New ARR +31% to a record $18.8M, the highest organic growth rate as a public company.
Customers with ARR over $100K: +21% to 629, adding a net total of 35 such customers from Q2, the most ever added in a single quarter.
Channel Contribution 53% of total ARR came through the channel, compared to 50% a year prior. 68% of incremental ARR came through the channel.
Gross Retention Rate (GRR) 88% (FX adjusted), the highest reported to date. On a reported basis, Q3 GRR was 87%, compared to 85% in Q3 2023.
Net Retention Rate (NRR) 110% (FX adjusted), from 108% a year ago. The reported NRR was 109%, compared to 107% in Q3 2023.
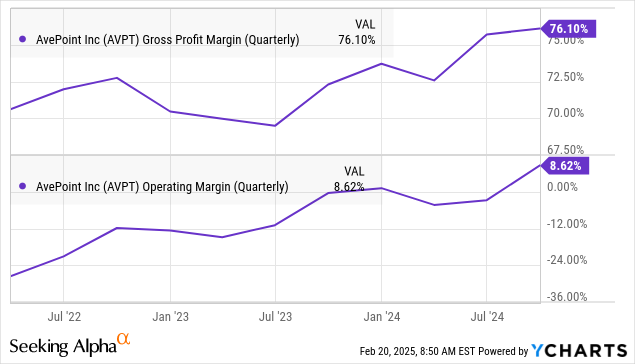
Gross margin of 77%, compared to 73.7% in Q3 2023 and 76.2% in Q2 2024.
OpEx at 57% of revenue or $50.5M, compared to $44.3M, or 61% of revenues, a year ago.
Operating Income $17.8M, operating margin +720bp to 20.1% due to prudent expense management, optimizing operational processes, and negotiating favorable terms with vendors. The company achieved a record low sales and marketing expense as a percentage of revenue at 31%.

GAAP Profitability achieved in Q3, as well as for the first nine months of 2024, with cumulative GAAP operating income of $2.3M, compared to a GAAP operating loss of $16.2M in the first nine months of 2023.
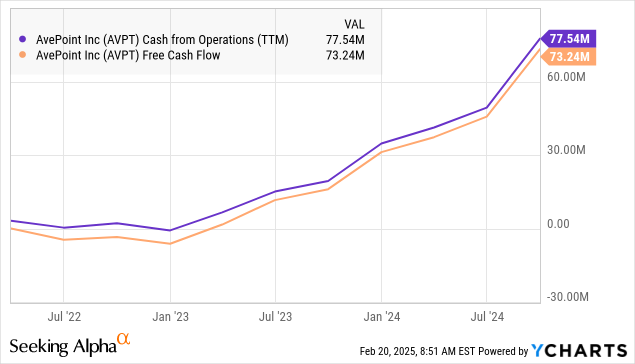
Cash Flow from Operations $56.1M for the 9 months ended September 30.
Free Cash Flow $53.8M for the 9 months ended September 30.
Cash and Short-Term Investments $250M.
Financial Outlook
For Q4 2024, AvePoint expects total revenues of $86.5M to $88.5M (approximately 17% y/y growth). This is somewhat lower than the Q3 result ($88.8M) and the topline growth is also lower than its 3-year average of 20%.
Non-GAAP operating income of $12.6M to $13.6M.
Q4 may be affected by around $1M of OPEX spend that was shifted from Q3 and management plans to increase programmatic marketing investments in Q4.
These factors may cause SG&A and S&M expenses to increase in Q4 and the operating margin to decline sequentially.
For the full year 2024, AvePoint now expects total ARR of $324.9M to $326.9M (approximately 23% year-over-year growth), total revenues of $327.8M to $329.8M (approximately 21% year-over-year growth), and non-GAAP operating income of $45.8M to $46.8M (an operating margin of 14%).
Valuation

There is more to come:

So, fully diluted there are 206.8M shares outstanding, at $17 per share that's a market cap of $3.93M and an EV of $3.68B. With FY25 revenue expected at $389.6M which delivers a 9.44x EV/S, and with an estimated FY25 EPS of $0.23, the earning multiple is also steep.
On the other hand, one does have to notice the company is approaching the rule of 40 (ARR growth + non-GAAP operating leverage), with guidance for FY24 improving from 29 in February to 31 in May to 37 on the Q3CC.
The company has a $150M share buyback program that is about to expire. Given the rapidly increasing cash, this might be a way to use the cash or they could acquire companies to close some holes in the competitive position (related to non-Microsoft environments).
Conclusion
Long-term we’re still bulls for the strong tailwinds from the market and the company’s excellent products, market position, and execution, as well as significantly improving financials (operating leverage, rapid increase in cash flow).
After an extended rally with inflation and interest rates elevated, economic growth possibly slowing and the stock fully valued, we would wait for more opportune entry points, although we’re fully aware these might not arrive.
Thanks for the write-up.
I have to say I am confused by the table of dilutive shares outstanding: how can the 2024 three and nine month figures differ? Are these time-weighted values (from the table itself it would not seem to be)?
Whats even more confusing to me is that the table you used is preceeded with the information that the share counts in that table have been excluded from the diluted earnings calculation bc they are anti-dilutive. Preceeding that statement is on page 29 another table in which the diluted shares is calculated as 203M (to be followed by the table that you used that seem to have been excluded from that calculation due to said anti-dilutiveness...) - on the whole that is very confusing to me. Do you have a view or explanation?